Product · Charting
Price, and everything moving it.
Every candle, layered with our own market intelligence — whale flow, liquidations, ETF flow, news and confluence. Plus Echo pattern search, pro drawing tools and formula-driven alerts. Built for crypto, from the ground up.
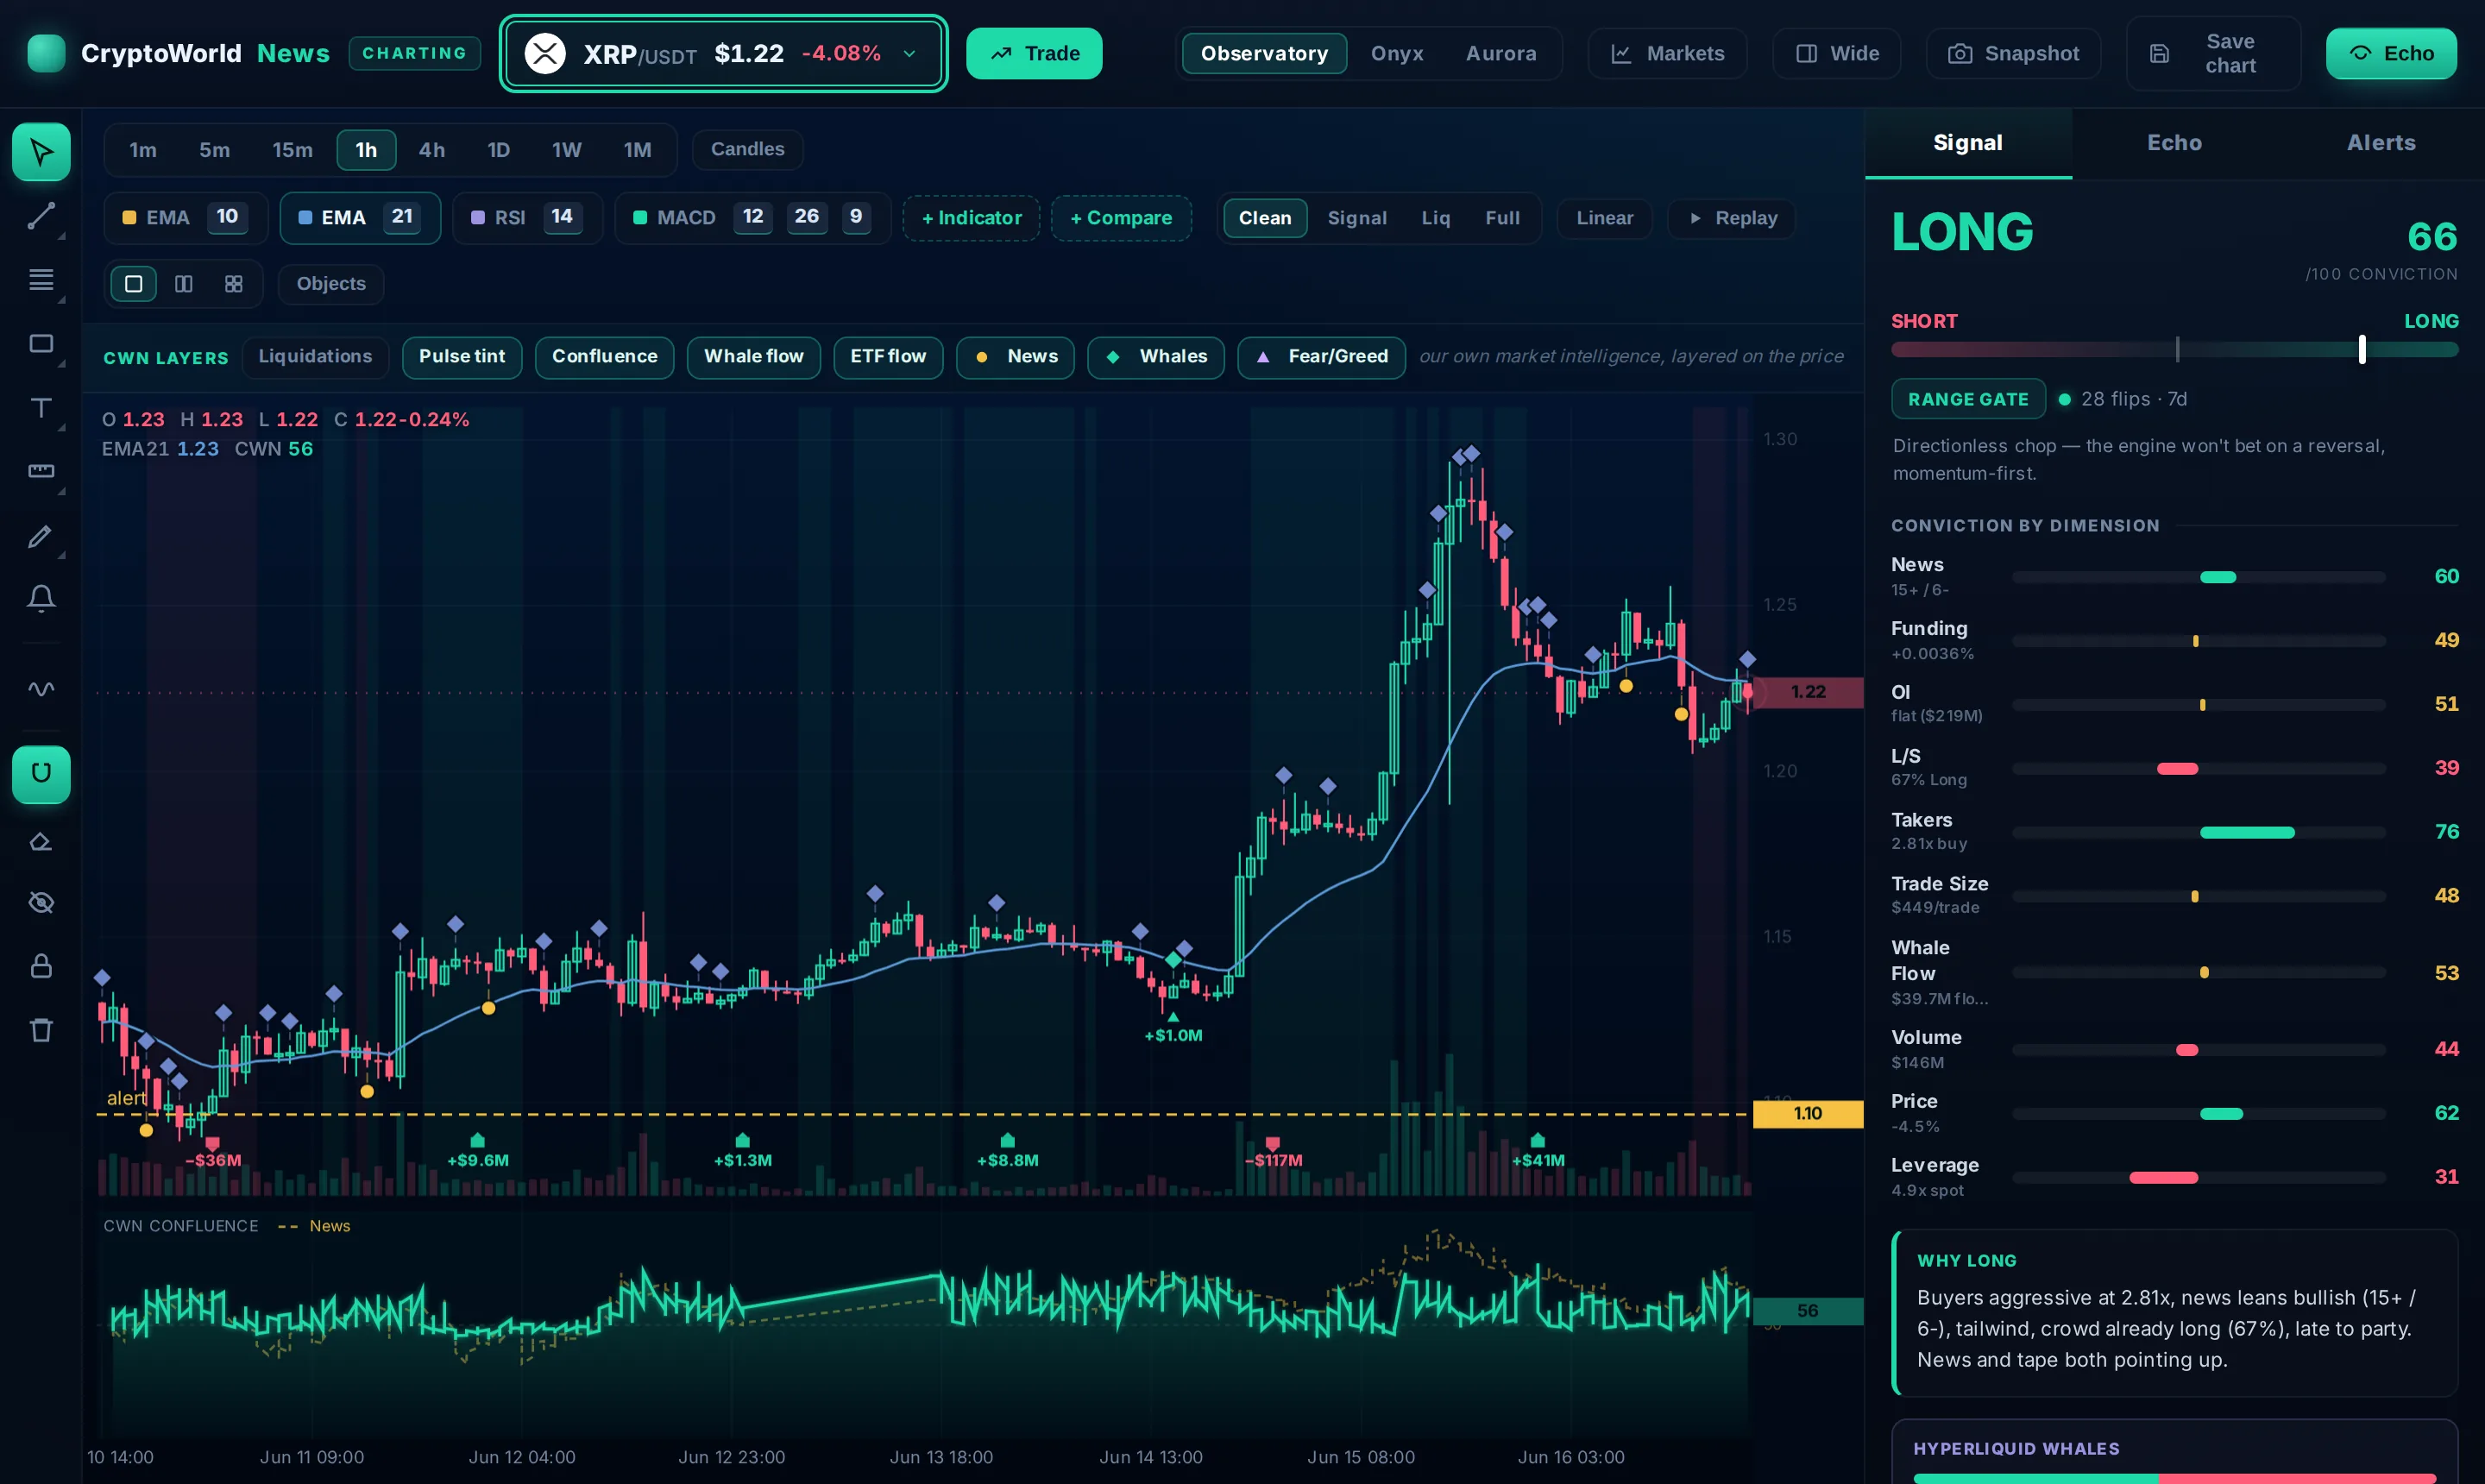
Our intelligence, on the price
Liquidations, whale flow, ETF flow, news, confluence and fear & greed — our own data, drawn straight onto the candles. Toggle any layer on or off.
Echo — draw a shape, see what followed
Sketch a price pattern and Echo finds the times it has appeared before across the market, then shows the historical distribution of what came next. Past patterns, not predictions.
A chart engine we built ourselves
Candles, moving averages, whale markers and news dots on a fast custom canvas — no third-party iframe. Replay steps the chart forward bar by bar to test a setup.
Pro drawing tools
Trendlines, Fibs, channels, Andrews pitchfork, measure, a long/short position tool and freehand — saved per chart and usable on touch.
Indicators you can script
EMA, RSI, MACD, Bollinger, VWAP and ATR — edit any period inline, or write your own formula with crossovers, comparisons and logic.
Alerts that watch for you
Price levels, % moves, RSI, EMA crosses, volume spikes, CWN-signal flips — or your own formula. Pushed to your phone, with optional webhooks for bots.
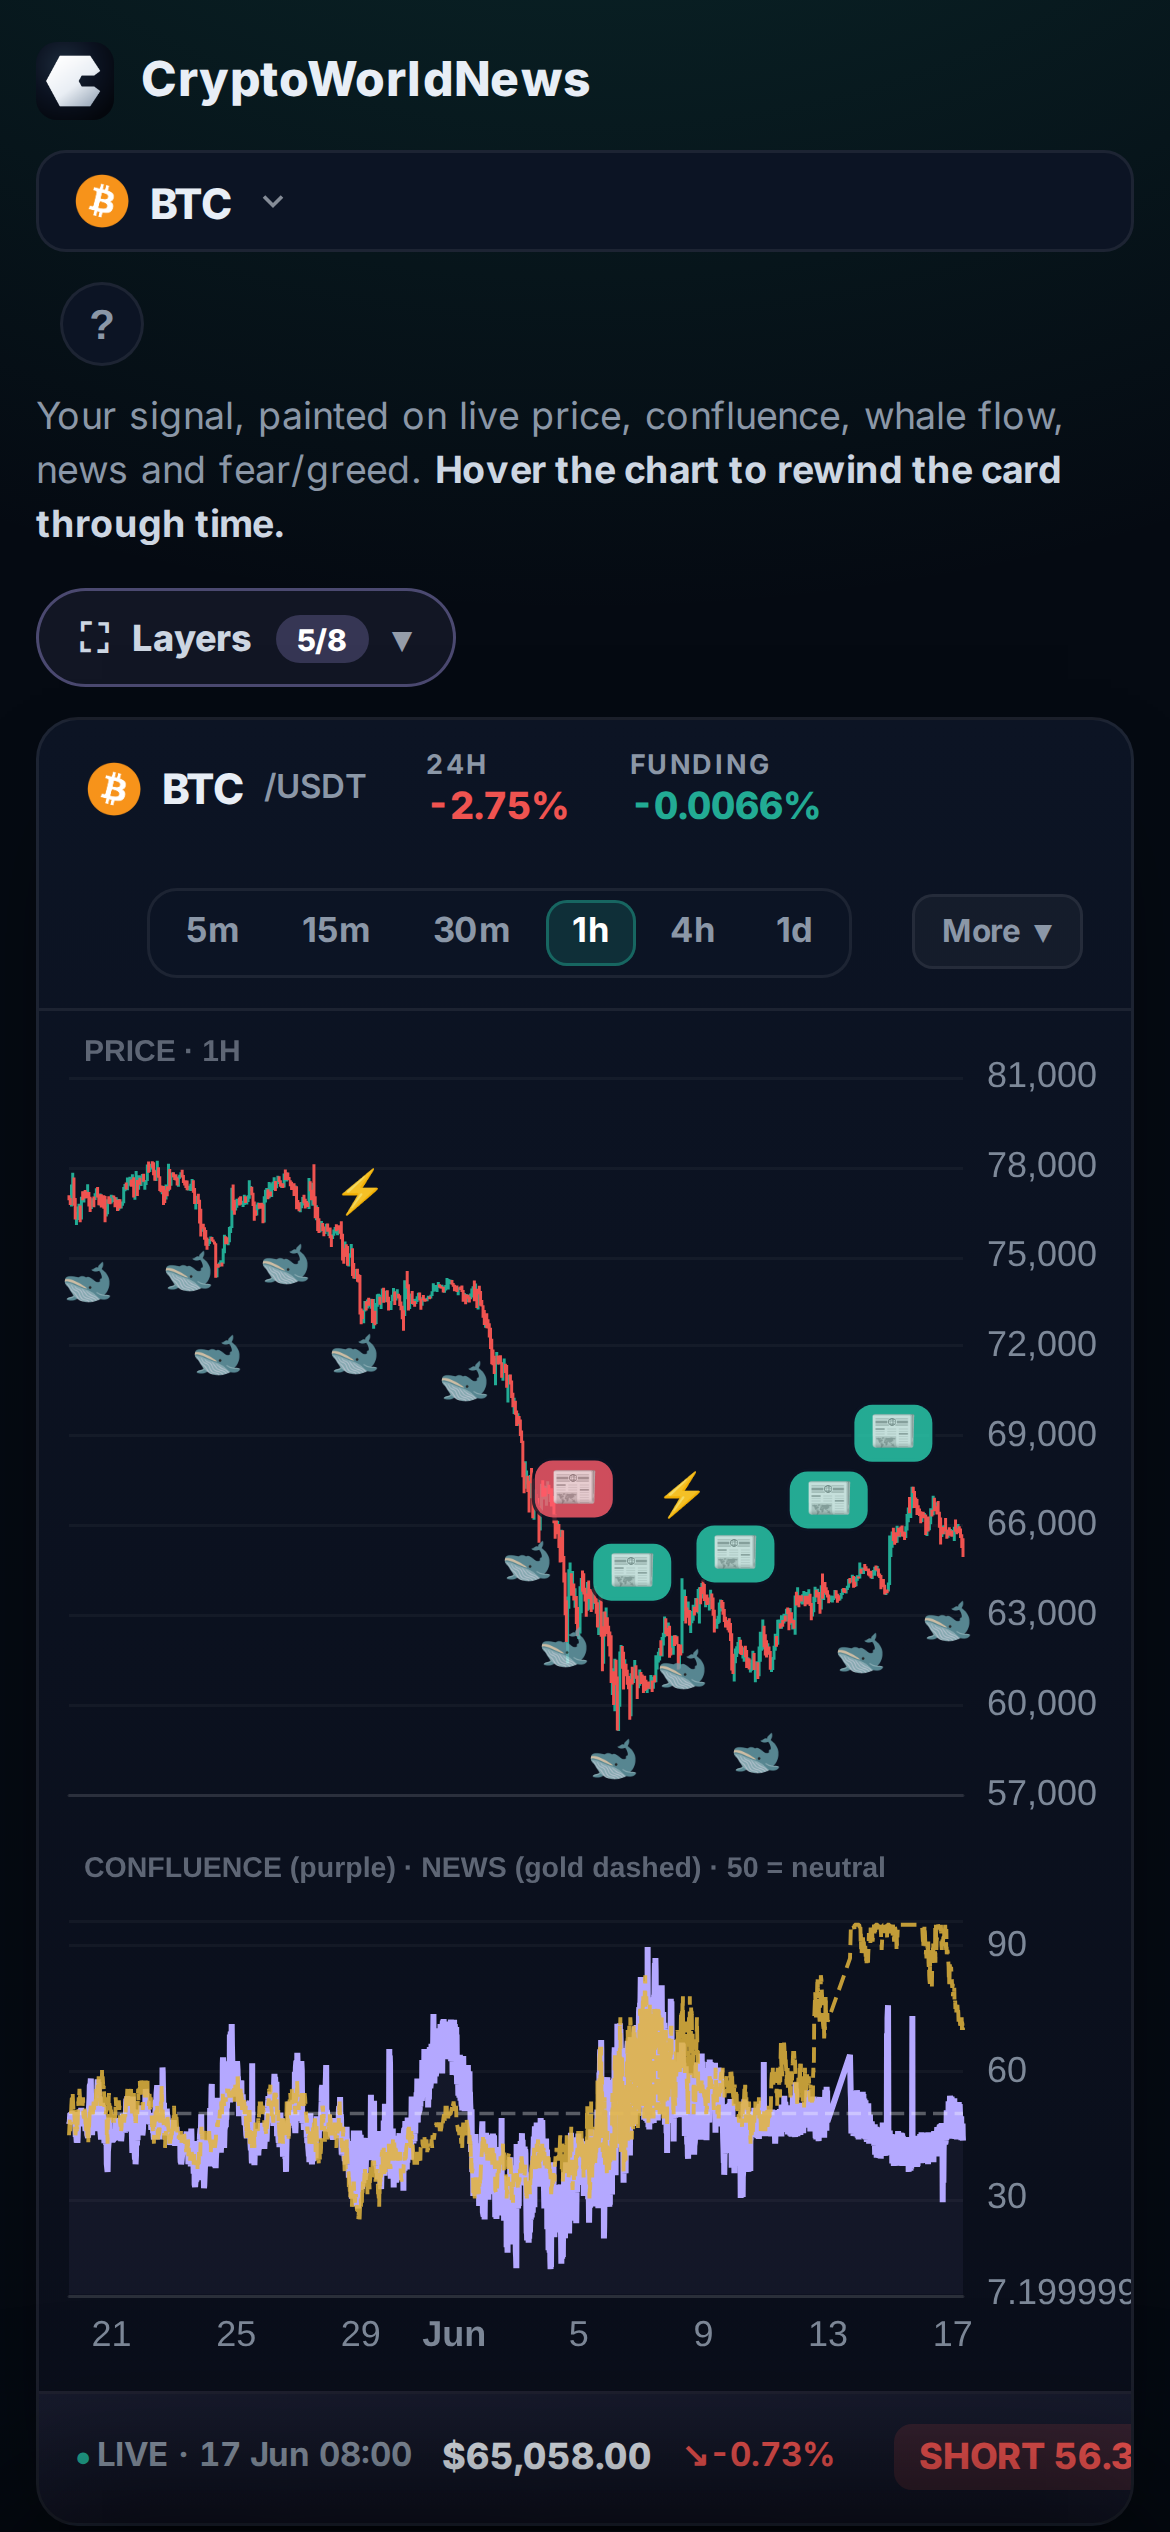
Desktop & mobile
Right tool for the screen.
The full workbench above is built for a big screen — drawing, scripting, multi-pane. On your phone it streamlines to a fast read: your signal painted on live price, the layers, timeframes and alerts. Same intelligence, tuned for a glance on the go.
More than a chart.
Most charts draw price and stop there. Ours draws price plus the on-chain and derivatives intelligence the rest of CryptoWorld News already tracks — on the same screen, scored, with a long/short read for every coin. No tab-switching, no stitching tools together.