A whale moves 500 BTC onto Binance. Funding flips positive. A mid-tier altcoin gets mentioned on TV. Three signals, three trades, three ways to lose money in the same week.
This is what most retail trading actually looks like. A signal shows up, you click. A different signal shows up, you click again. It feels decisive. It isn't. It's reactive, and it's expensive. The traders who make it through their first few cycles figure out that no single signal is worth a position. The ones who keep making it learn to wait until several unrelated signals agree before they touch anything.
That's confluence. A dull word for a simple idea: don't act on one thing, act when a few things point the same way.
Why the "best signal" debate misses the point
There's a never-ending argument in crypto Twitter about which signal actually works. Funding rates. Whale wallets. Exchange reserves. Fear and greed. Dominance charts. It's the wrong argument, because every signal has roughly a coin-flip hit rate when you look at enough examples.
Funding rates are useful when extreme funding meets a weakening trend. In a strong rally, funding can stay hot for two months and everyone trying to short the squeeze gets run over the whole time.
Whale alerts are useful when you already have context. A 10,000 BTC deposit to an exchange could be a fund distributing, a custodian rebalancing cold storage, or an OTC desk setting up a block trade. Three different conclusions, same on-chain event.
News is useful when you stop trusting it. One of the most consistent lessons of the last five years is that good news often gets sold and bad news often gets bought. On its own, a headline tells you almost nothing about what price will do next.
None of these signals is reliable alone. What changes the maths is stacking the ones that measure genuinely different things and only trading when several agree.
The word "independent" is doing most of the work
This is where most dashboards and indicator setups fall apart. Five moving averages aren't five signals. They're one signal dressed up five ways. Same with stacking five oscillators , they're all derived from the same price data, cooked differently.
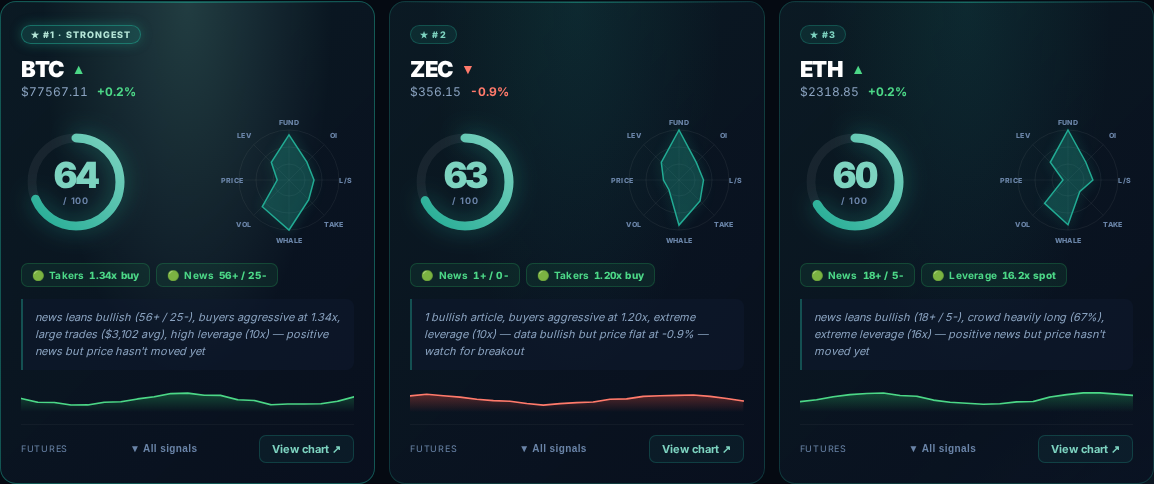
Real independence comes from sources that don't feed off each other. Price action tells you what the market is doing in real time. Funding tells you how perp traders are positioned. Open interest tells you whether fresh capital is entering or old positions are closing. Whale flow tells you what the biggest holders are choosing to do with their supply. Exchange reserves tell you whether coins are being moved off to hold or onto platforms to sell. News sentiment tells you what the headline stream looks like. Each of those is measuring a different part of the picture.
When four or five of them point the same direction at once, that's a setup worth sizing into. When one lights up and everything else is flat, that's a guess with a story attached.
None of this is theoretical , every score gets logged
The only way to know whether a scoring approach actually works is to track the outcomes. Every score the dashboard produces gets logged the moment it's calculated , entry price, the per-signal breakdown that built it, and a row for the 3h / 6h / 12h / 24h result.
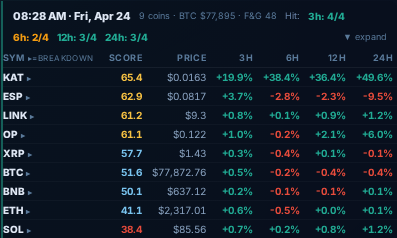
Here's a row from yesterday morning's snapshot. KAT scored 65.4. Open the breakdown and you can see exactly what made it score that way:

Funding was pinned at −0.62% , shorts paying longs to hold, the strongest possible reading on that signal. Open interest up +1.8% with $16M of new positions. Leverage at 6.7x. The price signal was actually downgraded , KAT had already moved +15% on the day, so the model penalises it as "late". But the funding/OI/leverage stack was strong enough to push the overall score to 65.4 anyway. The outcome row to the right is the honest part: +19.9% in three hours, +38.4% by six, still up +49.6% a full day later.
And not every score works out , the only thing more important than tracking the wins is tracking the misses. Same snapshot, full picture: KAT was the standout, but ESP scored almost the same (62.9) and faded −9.5% by 24h. LINK and OP scored in the low 60s and ground out modest gains. The middle of the table is mostly chop. ETH and SOL both scored under 42 , and both stayed flat-to-red across every window:
Some score and run. Some score and fade. Some never trigger at all. The point isn't that a 65 guarantees a move , it's that every score gets tracked against what actually happened, so over time you build up a real answer to the only question that matters: does this pattern pay off for my style, on the coins I care about? Rather than guessing.
The boring truth about how this works in practice
Most days, nothing happens. Most days, the signals are mixed, price is chopping, and the correct trade is no trade. That's the part everyone skips, and it's the part that matters most.
A confluence-led approach means sitting in cash the majority of the time, then sizing up when the dashboard is screaming. Good systems aren't about catching every move. They're about avoiding the fifteen half-decent-looking trades a month that quietly bleed the account down.
You don't need a tool to try this. Pick two or three coins you actually follow. Before every trade, write down where funding sits, what open interest has done in the last 24 hours, what whales have been doing in the last couple of days, and what the news tape looks like. If four of those agree with your thesis, take the trade. If only one or two do, walk away. Log the results for a month.
The hit rate on the "four agree" trades will be visibly higher than on everything else. The sample isn't perfect, but the pattern shows up quickly. That's the entire game , not finding the magic indicator, but refusing to act until enough boring, independent things line up.
CryptoWorldNews runs this scoring live across 30+ coins , price, funding, open interest, whale flow, exchange reserves, news, and sentiment, all feeding into one number per coin that updates every 90 seconds. Start a free 7-day trial, no credit card required. £14.99/month while founding spots remain, £24/month after. 14-day money-back guarantee.
Related reading
- What whale movements actually tell you (and what they don't). One of the signals you stack inside the score, and how to read it without overreacting.
- Why headline-trading loses money (and what to do instead). The opposite of confluence: trading single news items in isolation.