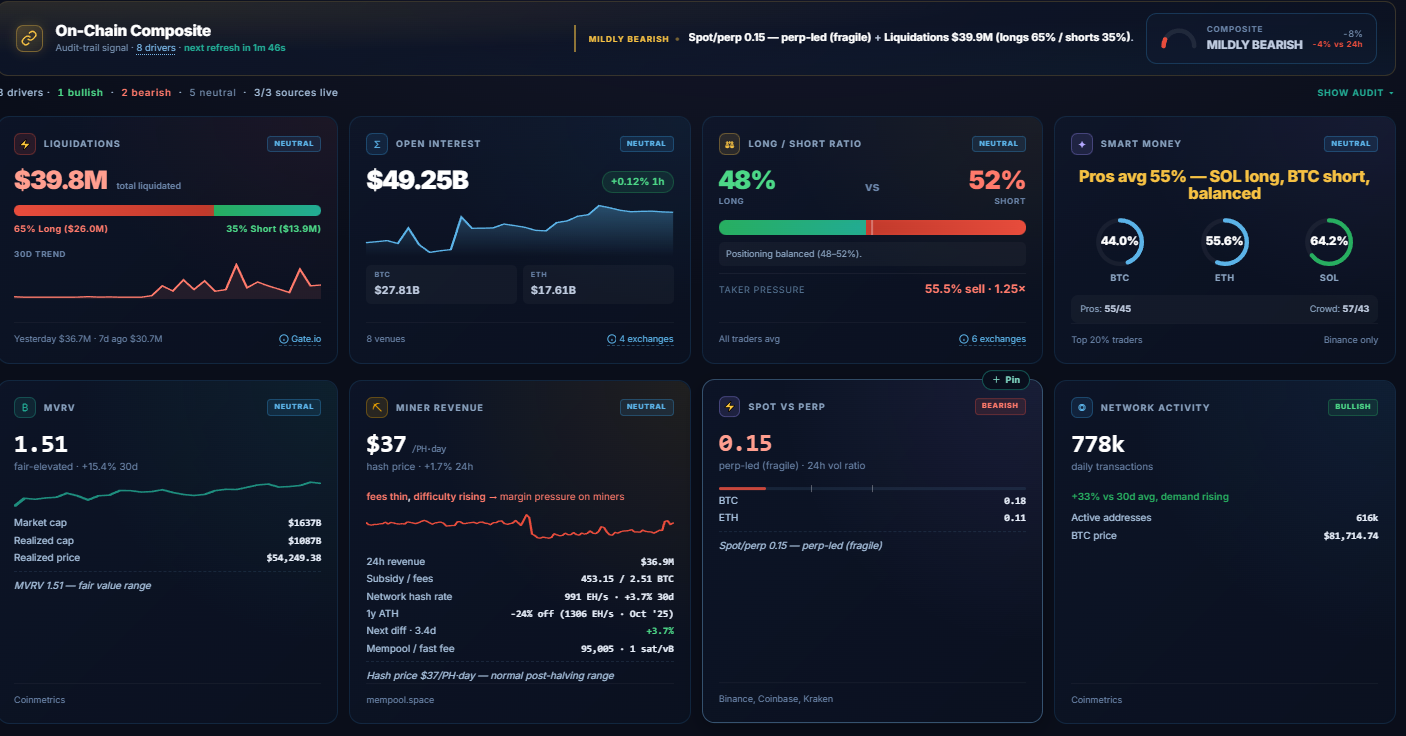
The screenshot above is the On-Chain tab on cryptoworldnews.world on 12 May 2026. The composite score reads minus 8, mildly bearish. Twenty-four hours earlier it read minus 4. Below the header sit eight driver tiles. One carries a bullish chip (network activity). One carries a bearish chip (spot vs perp). The other six read neutral.
Four traders looking at that single screen could reach four different conclusions. The MVRV reader sees fair value. The hash-price reader sees tight miner margins. The spot-versus-perp reader sees leveraged speculation. The network-activity reader sees demand rising. Each one is correct about their own tile. None is correct about the market. That gap is the whole problem this tab is trying to solve.
What on-chain data is, briefly
On-chain data is the public record of what the blockchain has done: transactions confirmed, addresses active, miners paid, tokens issued, exchange wallets credited and debited. Valuation ratios like MVRV are derived from that record. It is distinct from price data, which lives on exchange order books, and from purely off-chain activity like OTC desk trades that can sit between two parties' books without a corresponding on-chain transfer.
Read carefully, on-chain data shows the activity that produced the current market state. Read carelessly, the same dataset will justify any conclusion you bring to it.
The eight tiles, in order
Liquidations, $39.8M, neutral. Long liquidations $26.0M (65 percent of the total), short liquidations $13.9M (35 percent). Yesterday $36.7M, seven days ago $30.7M. Aggregated from Binance, Gate.io, and OKX. Long-skew matters: longs got squeezed harder than shorts in the last 24 hours, but the absolute total is in line with the trend.
Open interest, $49.25B, neutral. Up 0.12 percent over the last hour. BTC OI $27.81B, ETH OI $17.61B, aggregated across eight venues. Flat. No fresh capital piling in, no positions rushing out.
Long/short ratio, 48/52, neutral. All-trader long/short positioning averaged across six exchanges. The tile labels this "positioning balanced". Taker pressure is 55.5 percent sell at 1.25× intensity, a soft sellers-in-control reading but not a regime change.
Smart money, pros average 55 percent long, neutral. Top 20 percent trader long/short bias on Binance. BTC pros 44.0 percent long (slight short lean), ETH 55.6 percent long, SOL 64.2 percent long (long lean). The cross-coin average sits balanced. Pros 55/45, crowd 57/43. Single-coin reads here are noisy. The cross-asset average is the reading worth tracking.
MVRV ratio, 1.51, neutral. Market cap divided by realised cap, pulled from Coinmetrics' free community API. Market cap $1,637B, realised cap $1,087B, realised price $54,249. The ratio is up 15.4 percent over the last 30 days. The tile labels this "fair value range". Historically, MVRV above the high-3s has marked cycle tops and MVRV below 1 has marked capitulation. 1.51 is neither.
Miner revenue, $37 per petahash per day, neutral. Hash price computed from mempool.space block reward and fee data, divided by the current 991 EH/s network hash rate. 24-hour revenue $36.9M, subsidy 453.15 BTC, fees 2.51 BTC, mempool fast fee 1 sat/vB, next difficulty adjustment in 3.4 days at plus 3.7 percent. The tile labels this regime "normal post-halving range" and flags "fees thin, difficulty rising, margin pressure on miners". The chip is neutral because $37 sits inside the normal band. The tile narrative is bearish-leaning because fees are thin.
Spot vs perp ratio, 0.15, bearish. Spot volume across Binance, Coinbase, and Kraken divided by Binance perp volume. 0.15 means perps are running roughly 6.7× spot volume. BTC 0.18, ETH 0.11. The tile labels this "perp-led (fragile)". Leveraged speculation dominates real buying in this state, and reversions out of it tend to be sharp.
Network activity, 778k daily transactions, bullish. Active addresses 616k. Transaction count is 33 percent above the 30-day average. The tile labels this "demand rising". This is the only tile with a bullish chip on the current screen.
How the composite is built
Eight tiles, eight drivers in the score. The audit summary at the top of the header reads "8 drivers · 1 bullish · 2 bearish · 5 neutral · 3/3 sources live", which maps one-for-one to those eight tiles. Four of the drivers (liquidations, long/short, open interest, smart money) come from the same per-coin signal pipeline that the rest of the product uses. Three (MVRV, spot/perp, hash rate) hit external APIs directly. One (network activity) is synthesised from the MVRV fetcher's data so it does not require a separate API call. "3/3 sources live" means all three of the external API fetchers returned data this cycle.
Funding rates, ETF flows, stablecoin supply, and exchange netflow all live on their own tabs (Market, Supply, and Whales & ETFs) and feed those composites instead. They were deliberately taken out of the on-chain score in May 2026 so the number on this tab only reflects what is visible on this tab. No hidden inputs.
Tap the composite and the audit drawer opens. Every driver lists out with its current value, its polarity, its weight in the score, and its source. The composite is mildly bearish overall because two of the eight drivers lean bearish and one leans bullish, but the drawer is what tells you which drivers carried which polarity and how heavily each contributed.
How the deltas earn their keep
The composite is logged every fifteen minutes. The header offers a delta picker across four windows: 15 minutes, 1 hour, 6 hours, 24 hours. The picker is what shows you which timeframe a move is happening on.
In the screenshot, the 24-hour delta reads minus 4 points (score moved from around minus 4 to around minus 8 over the last day). The shorter windows look different. On the hour, the score is essentially flat. Six hours ago, it sat about three points lower than now. So the picture is: the score deteriorated over the last day, but has been drifting back toward neutral over the last six hours, and is currently sitting still. That is a slow grind, not an acute event, and a single headline number cannot show you the difference.
What the chain does not tell you
The on-chain record is the on-chain record. It does not tell you what a fund's redemption schedule looks like next week. It does not tell you what an exchange treasury team is doing across its own internal wallets. It does not tell you OTC flow, which by definition happens off the public ledger.
It also does not tell you which direction price will go in the next hour. None of these readings is predictive on that timeframe. They are contextual. They tell you what the underlying conditions are, not where the next candle will print.
That is worth saying clearly because the way on-chain data gets sold on Twitter is mostly fake. "On-chain says top is in" is a tweet, not a thesis. The chain says holders are sitting on a certain aggregate gain, miners are earning at a certain rate, the network is being used at a certain volume. Translating any of those into a price call is the reader's job, and the call gets a lot more reliable when several unrelated reads agree.
The takeaway
Most of the time the composite sits in neutral and the correct response is to ignore it. You do not trade every reading. You wait for several drivers to flip the same direction at once, or for the chain to disagree sharply with price, and then you act.
If there is one practical thing to take from this whole post: stop reading on-chain charts one at a time. Either look at four of them together, or do not bother looking at any. One MVRV chart screenshot is the same as one headline from CoinDesk. It feels like information and it is not.
The On-Chain tab on CryptoWorldNews runs eight live drivers with a full audit trail, weighted into one composite that logs continuously and exposes multi-window deltas. Start a free 7-day trial, no credit card required. £14.99/month while founding spots remain, £24/month after. 14-day money-back guarantee.
Related reading
- What "signal confluence" actually means (and why one signal is never enough). The same stack-the-evidence logic the On-Chain composite uses, applied across the nine-dimensional per-coin signal score.
- What whale movements actually tell you (and what they don't). The four different things a big on-chain transaction can mean, and why most whale-alert reactions are reading the wrong one.