
Most of the big, sudden moves in crypto start in one place: perpetual futures. They are where traders borrow to bet, and where those bets get closed by force when the price moves the wrong way. This lesson takes 90 seconds on video. The written version below goes one step further on each idea.
What a perpetual future is
A perpetual future (a "perp") is a bet on a coin's price that never expires. You never own the coin. You only bet on which way it goes: a long makes money if the price rises, a short makes money if it falls.
Normal futures contracts end on a set date. A perp does not, which is why traders can hold one for an hour or a year. That is also why it needs a way to stay tied to the real price, which is what funding (further down) is for.
Leverage: trading with money you don't have
The reason most people use perps is leverage. Put down $1,000 and the exchange lets you trade as if you had $10,000. That is 10x leverage: $1,000 of your own money (the margin) and $9,000 borrowed against it.
If Bitcoin rises 10%, a $10,000 position gains $1,000, so your $1,000 has doubled. That is the pull.
Liquidation: why a 9.6% drop is enough
The same arithmetic runs the other way. If Bitcoin falls 10%, the $10,000 position loses $1,000, which is all of your money. The exchange does not wait for that: it closes your position for you a little earlier, while there is still a small cushion left. That forced close is a liquidation.
The cushion is called the maintenance margin. On a 10x long with a 0.4% maintenance margin (a common level for a small Bitcoin position), the exchange keeps $40 of the $10,000 position aside. You can lose $960 before you are closed out, and $960 is 9.6% of $10,000. So a drop of 9.6% wipes out the bet, before fees. At 20x it is under 5%. At 50x it is under 2%.
Funding: how the price stays honest
Because a perp never expires, nothing forces its price to meet the real coin's price on a set day. Funding does that job. At regular times, the crowded side pays the other side:
- When the perp trades above the coin's real price (too many longs), longs pay shorts.
- When it trades below (too many shorts), shorts pay longs.
Most big exchanges settle funding every 8 hours; Hyperliquid settles every hour. In a calm market the rate is often around 0.01% per 8 hours. That sounds like nothing, but it is three payments a day: 0.01% × 3 × 365 = 10.95% a year if you hold through every one. Funding is a real cost of holding a leveraged bet, and when it spikes it tells you one side has become very crowded.
Cascades: how liquidations feed on each other
A liquidation is a forced sale. When the price falls and long positions start getting liquidated, the exchange sells them into the market. That selling pushes the price lower, which reaches the next group of traders' liquidation prices, which forces more selling. That chain is a liquidation cascade, and it is one reason crypto can drop several percent in minutes without any news.
Short squeezes: the same thing in reverse
It works upwards too. When too many traders bet on a fall, a small rise starts liquidating shorts. A liquidated short is a forced purchase, and forced buying pushes the price up into the next row of shorts. That is a short squeeze.
Our view
Leverage doesn't decide where the price goes. It decides how violently it gets there. The levels where crowded bets get wiped out often act like tripwires: the price doesn't have to stop there, but if it reaches them, it tends to move fast.
See it live on our dashboard
Everything in this lesson is something you can watch on the Crypto World News dashboard.
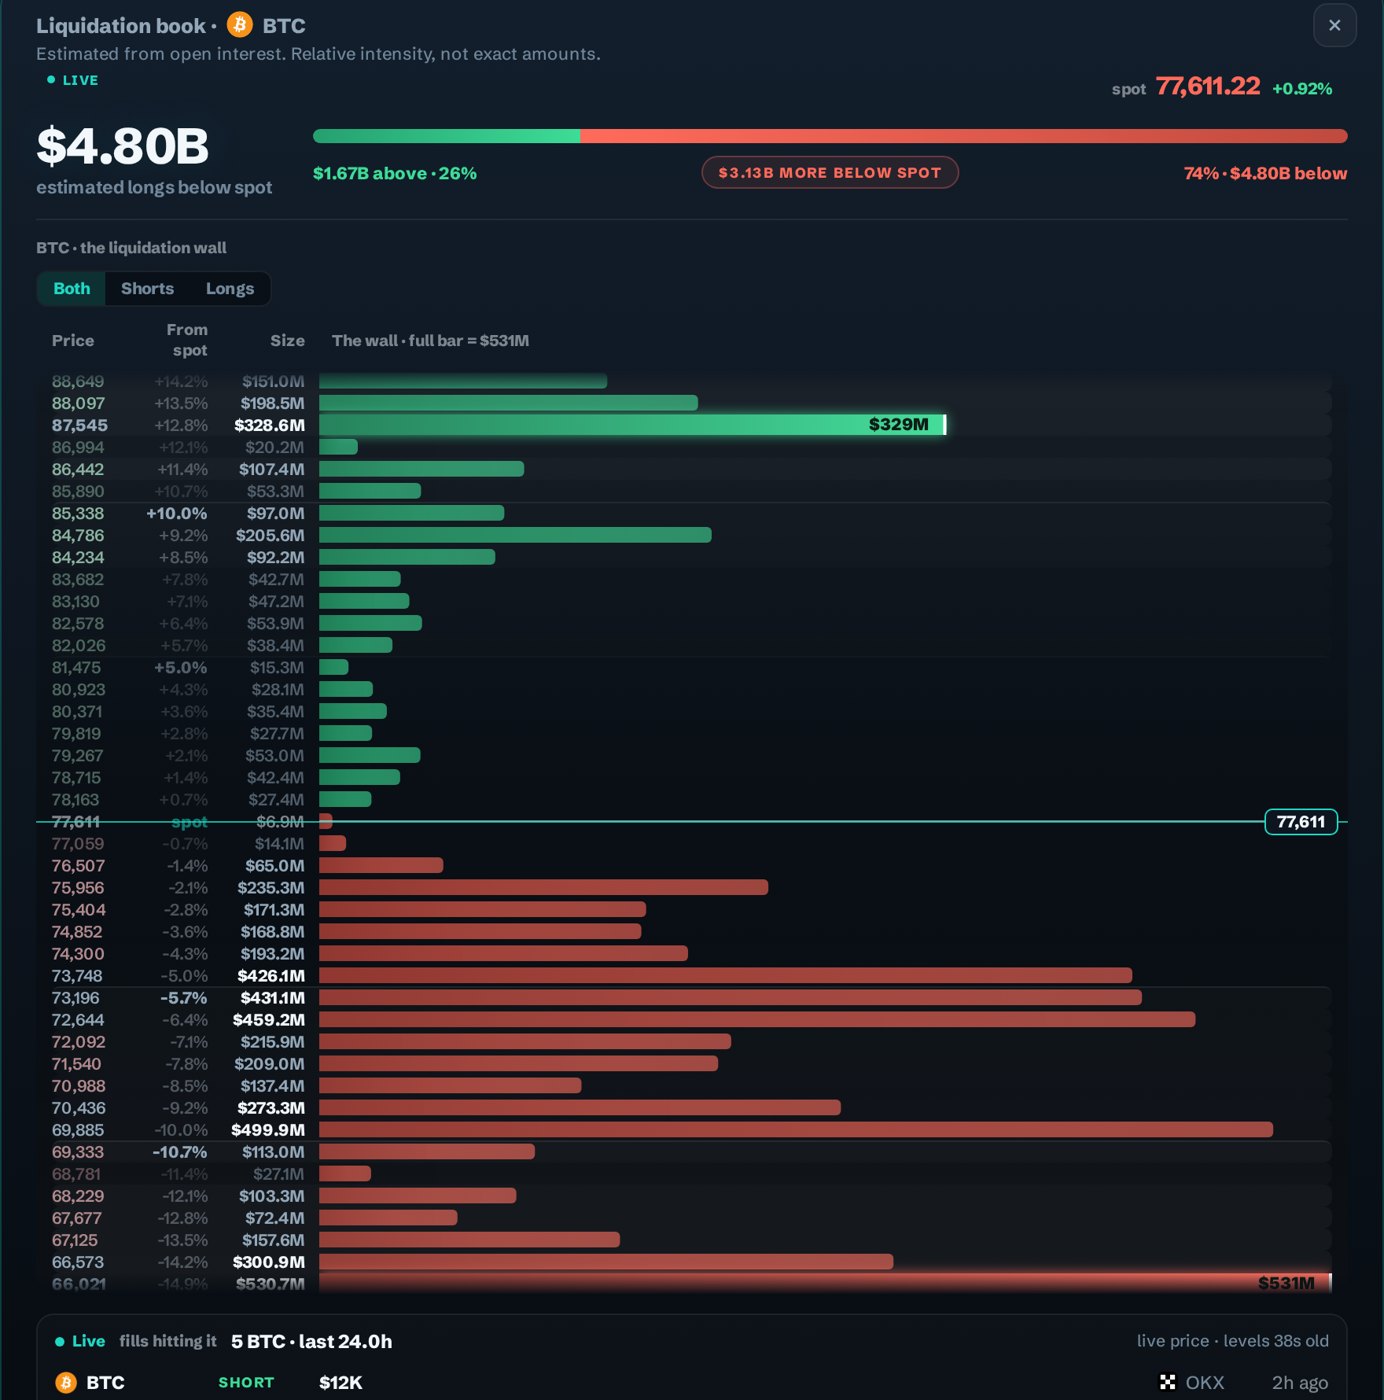
The liquidation wall. On the On-Chain tab, click any coin to open its liquidation book: our estimate, from open interest, of where leveraged positions would be force-closed, longs below the price and shorts above. When we captured Bitcoin on 31 October 2026 at 20:22 UTC, the biggest pool of longs, about $500M, sat 10% below the price, right where a 10x long gets wiped out.
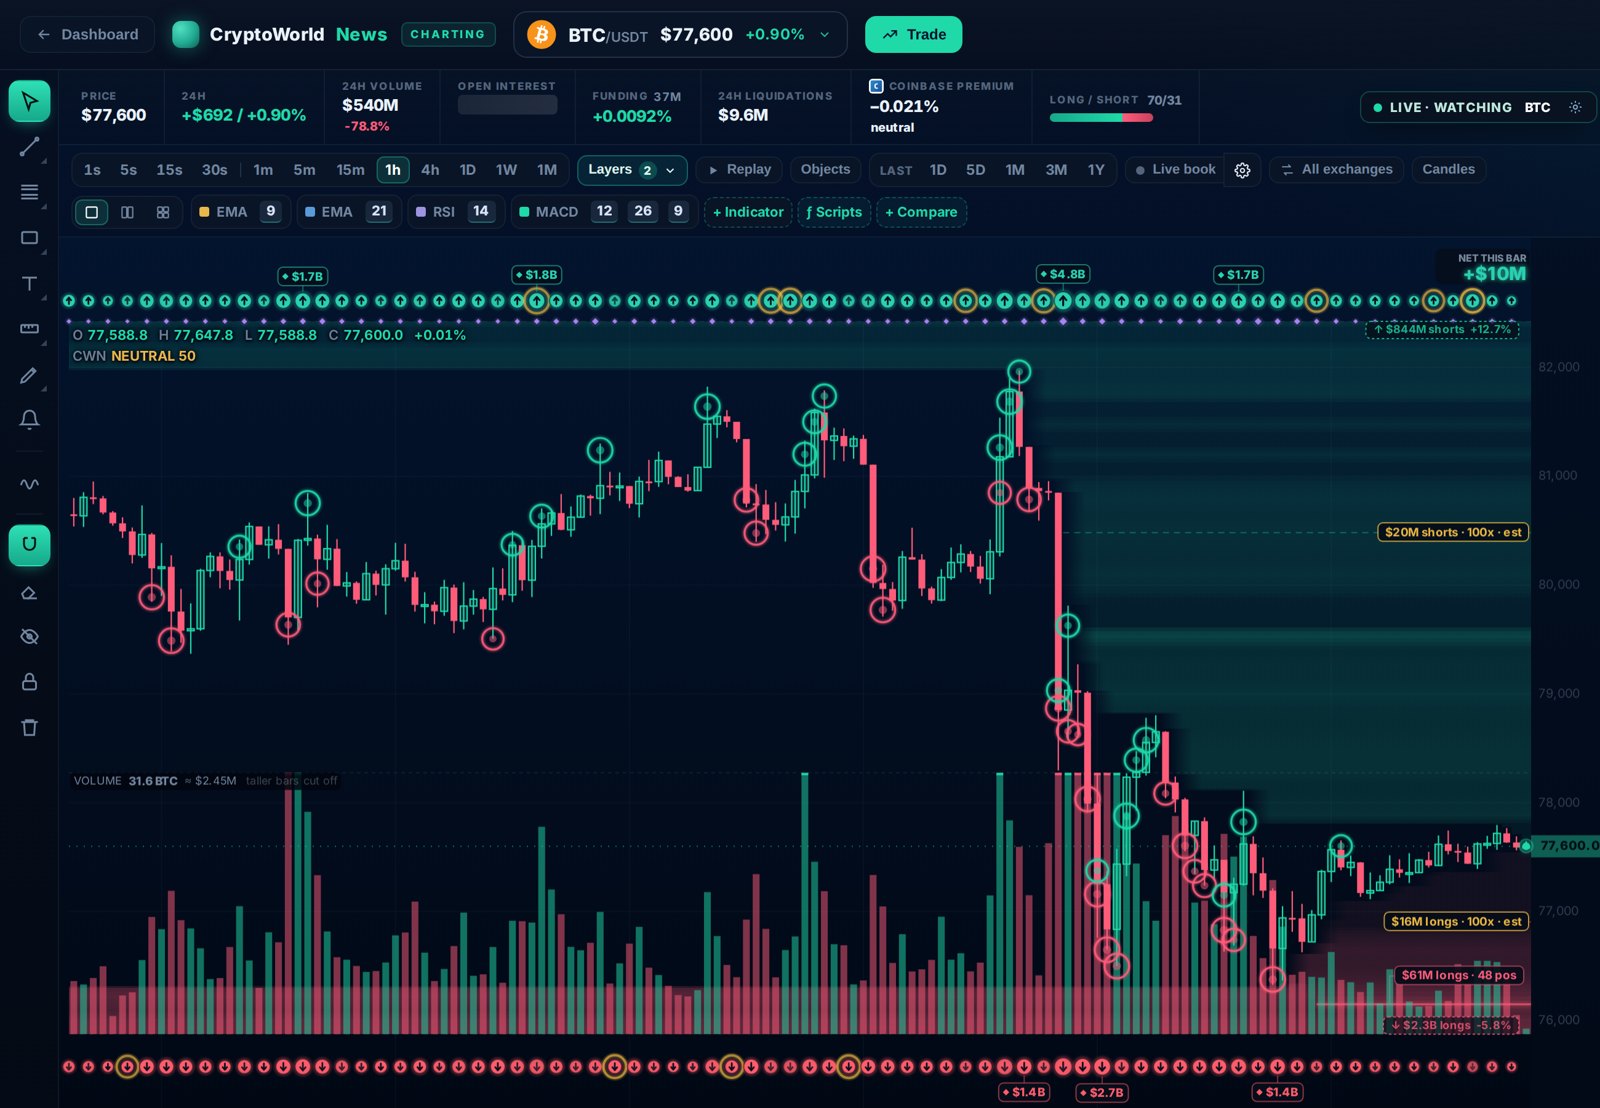
The levels on the chart. On any coin's chart, open Layers and pick Liq. The same estimated zones are painted on the price: shorts above, longs below, brighter where the pool is bigger.
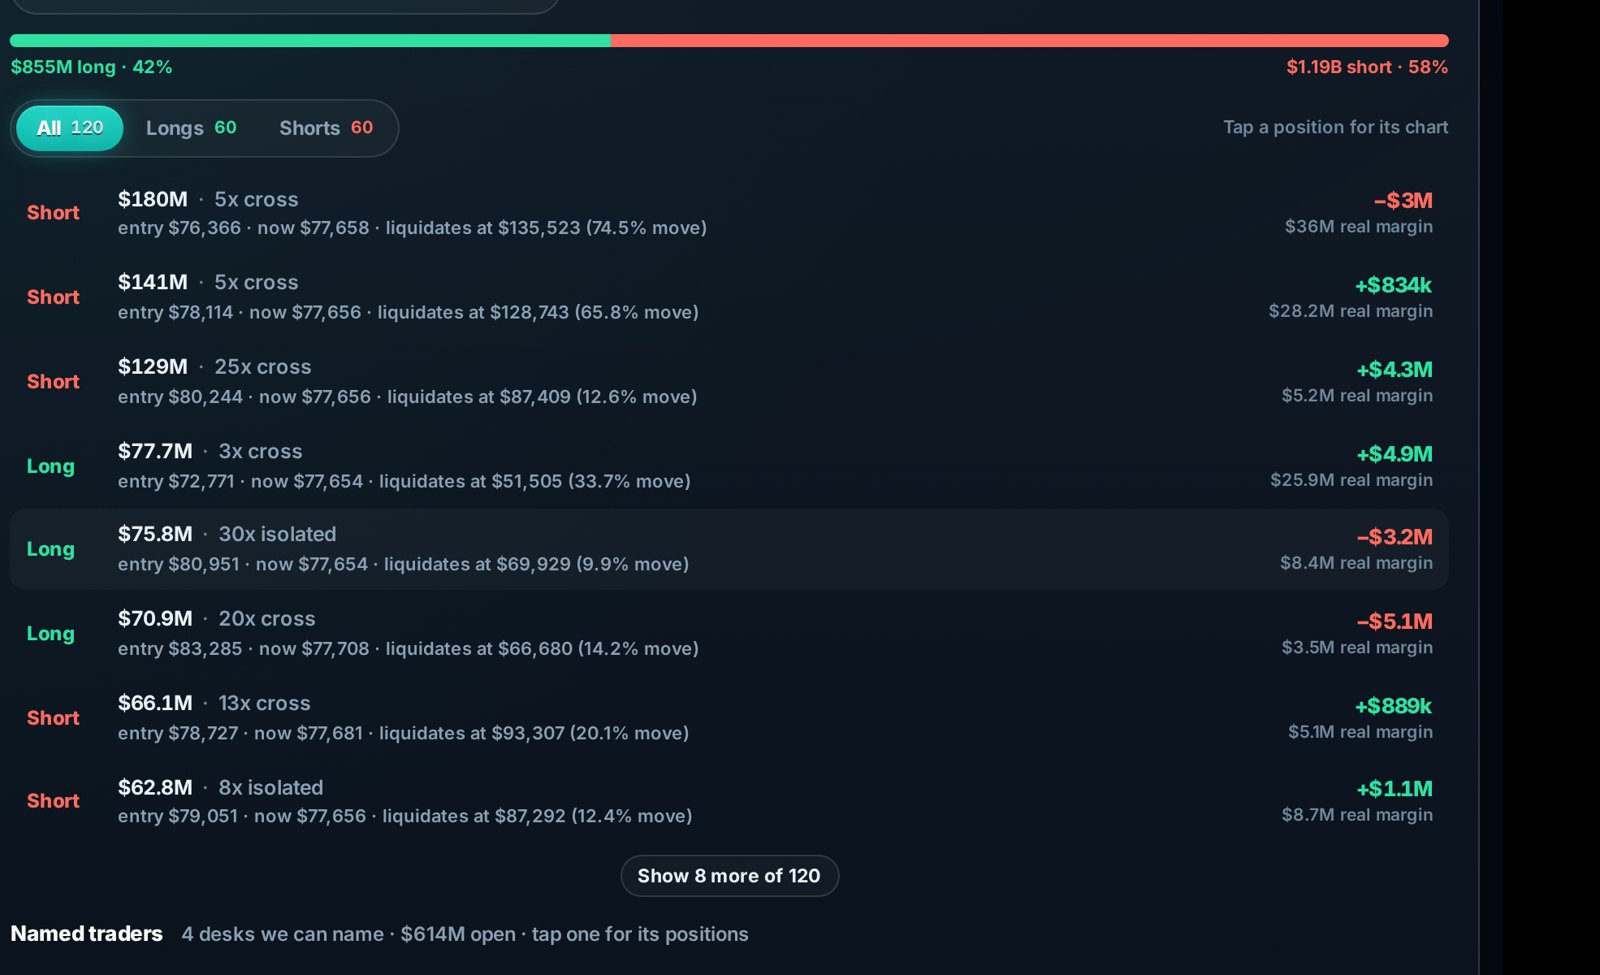
The whales' bets. On Whales & ETFs, the HL perps view lists the biggest open positions on Hyperliquid, each with its leverage, its liquidation price and how far away that is.
See where the leverage sits before the price gets there, on the liquidation wall, the chart's Liq layer and the whale positions. Start a free 7-day trial, no credit card required. £14.99/month while founding spots remain, £24/month after. 14-day money-back guarantee.
Related reading
- How to track crypto whale wallets. What big money is doing on-chain, and how to read it.
- Why one crypto signal is never enough. Funding and leverage are two signals among several.
This lesson explains how perpetual futures work. It is not financial advice, and nothing here tells you to trade.